Chapter 2.3 — Power & Data Centers
A GPU can arrive in months; the transformer, turbine, substation, and grid connection behind it can take years. That timing mismatch is why “available megawatts” matter more than national generation totals. This chapter follows a data-center order into the physical equipment and permits required to turn announced capacity into commissioned compute.
Every chapter so far has described things that consume electricity. This one is about whether the electricity exists. A modern AI data center is less a building full of computers than a substation with servers attached: a single frontier campus now draws as much power as a mid-sized city, and the constraint on building more of them has shifted decisively from the chips inside to the power outside. Jensen Huang and Sam Altman both say it plainly now, the binding limit on AI is electricity, not compute. Understanding this layer means understanding two things in sequence: how big the demand has become, and why the supply cannot keep up.
Start with a hypothetical 100 MW AI facility. The label sounds precise, but it can refer to two different boundaries. IT load is the electricity available to servers, networks, and storage. Gross facility load also includes cooling, pumps, power conversion, lighting, and other building systems. A facility with 100 MW of commissioned IT capacity therefore needs more than 100 MW from the grid. The relationship is expressed through power usage effectiveness, or PUE: total facility power divided by IT power. A PUE of 1.2 means 100 MW of computing equipment requires roughly 120 MW at the site boundary.
Even that 120 MW is not yet an operating AI factory. The developer needs a site, a utility agreement, a grid study, high-voltage transmission access, transformers, switchgear, backup generation, water or another heat-rejection plan, construction labor, and permission to energize the load. Each item follows a different schedule. The servers may be ordered after the building is under way; the transformer may need to be reserved years before delivery; a new transmission line may take longer than either. One missing component can prevent every completed component from earning a return.
That is why this chapter uses deliverable megawatts as its unit of analysis. A national electricity surplus is not useful to a campus if the local substation has no capacity. A signed power-purchase agreement is not useful if the generator or transmission connection is unfinished. An announced campus is not useful if it has only a fraction of the transformers needed to energize its halls. The investment opportunity lies in the conversion chain between a power plan and a working load.
Why national demand growth becomes a local shortage
The numbers are stark and they come from sober sources. The International Energy Agency puts global data-center electricity use at roughly 415 TWh in 2024, rising to about 945 TWh by 2030, close to 3% of all electricity on earth and roughly a 2.3-fold increase in six years.1 In the United States, the Department of Energy's Berkeley Lab found data centers consumed about 4.4% of national electricity in 2023 and projected 6.7% to 12% by 2028.2 Nearly half of all US electricity-demand growth this decade traces to data centers.

Demand of that size runs straight into a grid that cannot connect it fast enough. Berkeley Lab's 2025 survey found roughly 2,060 GW of generation and storage waiting in US interconnection queues, about twice the entire existing US generating fleet, with median waits around five years nationally and more than eight in PJM, the mid-Atlantic grid. The price signal is unmistakable: PJM's capacity auction cleared at $329.17 per megawatt-day for 2026/27, against $28.92 two years earlier, roughly a tenfold jump, and data centers accounted for about 40% of the resulting $6.3B cost. Morgan Stanley estimates US data-center demand reaches about 74 GW by 2028 against a power shortfall near 49 GW, and Gartner projects that around 40% of AI data centers will be power-constrained by 2027. There is a skeptics' case, worth holding: interconnection queues are inflated by duplicate and speculative "phantom" requests, and more than 750 GW of requests were withdrawn in 2025, so some of the demand is not real. But the price and the withdrawals point the same way: the scarcity is real, and it is priced.
Who receives the order from a new AI campus
The build divides into those who generate the power, those who make the gear that moves it, those betting on new nuclear, and those who build the sites. The roster worth recognizing:
| Player | Ticker | Role |
|---|---|---|
| Constellation | CEG | nuclear IPP; restarting Three Mile Island |
| Vistra | VST | IPP; nuclear + gas fleet |
| Talen Energy | TLN | IPP; data-center PPAs |
| GE Vernova | GEV | gas turbines + grid equipment |
| Siemens Energy | ENR.DE | gas turbines + grid |
| Mitsubishi Power | 7011.T | gas turbines (sold out to 2028) |
| Eaton | ETN | electrical distribution gear |
| Vertiv | VRT | power + liquid cooling |
| Schneider Electric | SU.PA | electrical / data-center systems |
| Quanta Services | PWR | electrical construction / EPC |
| nVent, Powell | NVT, POWL | connection/protection, switchgear |
| Cummins, Caterpillar | CMI, CAT | interim gensets / engines |
| Oklo, NuScale | OKLO, SMR | small modular reactors (pre-revenue) |
| X-energy, Kairos | PVT (Amazon, Google) | SMRs backed by hyperscalers |
| Cameco | CCJ | uranium / nuclear fuel |
The table is best read as an order sequence rather than a list of interchangeable “AI power stocks.” A utility or independent producer first needs to supply energy and capacity. Grid-equipment manufacturers provide the hardware that moves and controls the electricity. Electrical contractors install substations and distribution systems. Data-center infrastructure suppliers convert incoming high-voltage power into the stable low-voltage supply used by servers and remove the heat those servers create. Backup-engine suppliers bridge outages or grid delays. Nuclear developers sit much farther out in time and must clear licensing, financing, construction, and fuel hurdles before any electricity is sold.
Revenue timing follows that sequence. Engineering and equipment deposits can appear years before the campus is commissioned. Construction firms recognize revenue as work progresses. Generators earn only when capacity is available or contracted, while a pre-revenue reactor developer can rise in value without producing either revenue or power. Two companies can benefit from the same campus announcement and still have completely different cash-flow duration, capital intensity, and failure risk.
Near-term power comes from old technologies, not distant promises
Solving a power shortage takes years, so the industry has split its response into a near-term bridge and a long-term endgame; distinguishing the two is essential for underwriting this layer.
The bridge is natural gas and nuclear restarts. Behind-the-meter gas, generation built on-site to bypass the grid queue, can be deployed in roughly eighteen months, and around 101 GW of it has been announced, though only about 2 GW is actually operating so far. The catch has moved to the turbine. GE Vernova's gas-turbine backlog reached 116 GW in mid-2026, targeting 125 GW by year-end; Siemens Energy is carrying a record order book above €130B; and Mitsubishi Power is sold out through 2028, so new reservations now book four to five years out. The interim gap is being filled with reciprocating engines from Cummins and trucked mobile turbines. Nuclear restarts are the other real near-term lever: Constellation is restarting the former Three Mile Island Unit 1 (its Crane Clean Energy Center) on a twenty-year Microsoft contract, fast-tracked to 2027 and backed by a $1B federal loan, and Holtec brought the Palisades plant in Michigan back online at the end of 2025, the first-ever US reactor restart.
Small modular reactors face a timeline mismatch
The endgame is small modular reactors, and here timing discipline matters because the market can price a 2030s technology as if it solves the 2027 crunch. The marquee deals are real but distant: Amazon with X-energy targeting 5 GW by 2039, Google with Kairos aiming at 500 MW by 2035, Meta committing to 1.2 GW from Oklo. Oklo itself broke ground at Idaho National Laboratory in 2025 and guides first power to late 2027 at the earliest, has no revenue and no reactor-design approval, and its market value has swung between roughly $5B and $13B on sentiment alone. When Truist initiated coverage of Oklo, NuScale, and Nano Nuclear in 2026, it rated all three Hold and told investors they "want proof." The timing distinction is straightforward: restarts and gas can add megawatts this decade; most new nuclear belongs to the next.
As racks densify, the power problem moves inside the building
Between the power source and the chips sits cooling, which has quietly become mandatory rather than optional. Nvidia's GB200 and GB300 rack-scale systems use direct-to-chip liquid cooling, with public rack-power estimates clustering around roughly 120–150 kW depending on configuration and measurement boundary. Nvidia had not published a comparable Vera Rubin rack-power specification at the cutoff, so precise next-generation figures remain estimates rather than product facts. Vertiv is the scaled incumbent, and its reference architecture claims large energy, footprint, and space savings; a field of specialists sits around it, including CoolIT, Boyd, LiquidStack, and Submer. Direct-to-chip has won the current generation while immersion cooling remains a niche waiting for the density that may eventually force it, and the coolant-distribution units that feed these systems are themselves a near-term supply constraint. The normalized package-to-rack-to-100-MW comparison is in §2.13.
A gigawatt campus is an industrial project, not a larger server room
The demand shows up physically as a new class of building: the multi-gigawatt campus. OpenAI and Oracle's Stargate flagship in Abilene, Texas is targeting roughly 450,000 Nvidia GB200 GPUs and about 1.2 GW, part of a program now running toward 7 GW and more than $400B on the way to a $500B, 10 GW headline. Meta's Hyperion campus in Louisiana scaled to 5 GW and more than $50B, drawing scrutiny over its water use, while its Prometheus site targets going online before the end of 2026. xAI's Colossus 2 in Memphis is heading toward roughly 1 GW, about 40% of the city's daily load, powered in part by dozens of portable gas turbines that ran without permits, the poster child for the permitting and environmental-justice risk these campuses create. The bull case, from UBS and others, is that queues and permitting physically cap overbuild, so what looks like excess behaves like a rolling upgrade; the bear case, from Man Group, is that power built for 2024–25 demand could strand by 2027–28. Both are testable against site cancellations, of which there have already been a few.
Scale changes the nature of execution. A conventional data center can often connect to infrastructure that already exists. A multi-gigawatt campus may need dedicated generation, new transmission corridors, multiple substations, large water systems, road and fiber upgrades, and a workforce large enough to resemble an industrial construction program. The customer is no longer simply buying a building; it is coordinating an energy and logistics system.
This creates two common analytical errors. The first is to treat every announced gigawatt as if it were already financed, permitted, built, and energized. The second is to treat the headline campus cost as revenue available to one supplier. In reality, spending arrives in stages and is divided among land, civil works, electrical equipment, cooling, computing systems, network infrastructure, financing costs, and operating expense. The 100 MW normalization in §2.13 exists precisely to keep these boundaries separate.
The least glamorous equipment often controls the delivery date
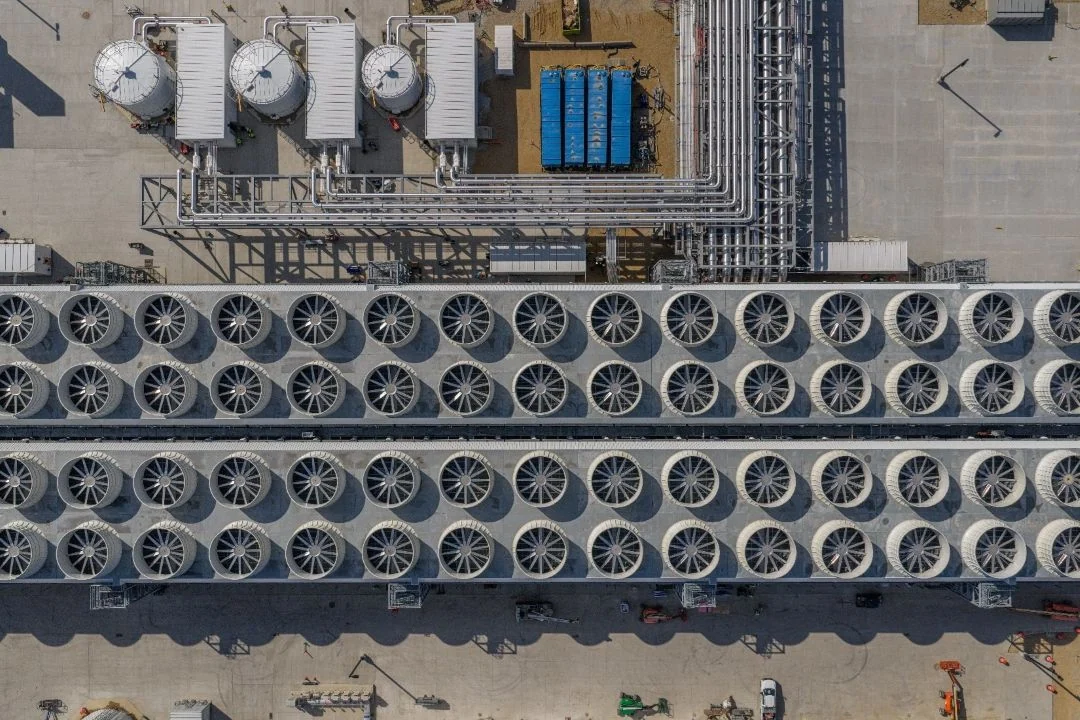
The electrical supply chain determines whether planned capacity can be energized. A gigawatt campus needs transformers, switchgear, and high-voltage equipment, much of which is currently allocated years in advance.

Large power transformers run 128 to 144 weeks, with the biggest high-voltage units quoted up to four years, against roughly a year before the boom; high-voltage breakers run about 125 weeks. The order books show the demand in real time: GE Vernova's electrification backlog reached about $76B against $38B of prior-year sales, a book-to-bill near 2.5; Eaton's data-center orders rose about 240% year on year; and nVent lifted its 2026 organic-growth guidance to 21–23%. Strong share-price performance means investors must now compare future backlog conversion with the expectations embedded in valuation.

Through 23–24 July 2026, approximate total returns were 58% for GE Vernova, 88% for Vertiv, and 28% for Eaton. The fundamentals are genuine and order-backed, but the crowding is genuine too, so the live edge is now in monitoring lead-times and book-to-bill for the inflection rather than in the thesis itself. One signal to respect: in May 2026 the North American reliability regulator issued a rare Level 3 alert after more than 1,000 MW of data-center load tripped off the grid in seconds, a reminder that the physics of connecting these loads is not yet solved.
The U.S.–China gap is the conversion of electricity into useful compute
This is the layer where the two systems diverge most, but “China has power and America does not” is too crude to be useful. The American problem is delivery: a grid that adds capacity slowly, permitting measured in years, and a gas-and-nuclear bridge running into equipment limits. China carries well over twice the installed generating capacity of the United States and can build substations and transmission faster. Its advantage is the ability to add physical supply, not proof that every announced compute campus will become productive capacity.
China has turned that capability into its "east-data, west-compute" program (东数西算), routing data centers toward western regions with cheaper hydro, wind, coal, and land. The unresolved denominator is utilization. Long distance, workload latency, software fragmentation, and the shortage of advanced chips can leave abundant electricity attached to less valuable compute. The comparison should therefore be commissioned IT megawatts multiplied by accelerator quality and actual use—not national generation capacity alone. For investors, the U.S. bottleneck is timely power delivery; China's is converting available power into high-utilization, leading-edge systems.
Measure deliverable megawatts, not announced megawatts
Power scarcity may cap some projects while shifting others to new regions or on-site generation. Data-center cancellations and contract renegotiations show whether announced demand is reaching construction. Continued withdrawals from the interconnection queue would indicate that some requests were speculative. PJM auction prices, transformer and gas-turbine lead times, and rules for cost allocation and large-load reliability provide additional evidence.
For a specific project, the monitoring sequence should be more concrete. Begin with land control and a named utility service territory. Then look for a signed interconnection agreement rather than a queue position, equipment reservations rather than vendor conversations, construction awards rather than a rendering, and an energization schedule rather than a target opening year. Finally, look for servers arriving and customer workloads moving into production. Each step removes a different kind of risk, and each step shifts the likely beneficiaries from developers and equipment vendors toward operators and power sellers.
When the investment case works
The power and electrical complex offers order-backed exposure to a physical deployment constraint, but the securities are not substitutes for one another. Constellation (CEG), Vistra (VST), and Talen (TLN) combine generation with contract, commodity and regulatory risk. Eaton (ETN), Vertiv (VRT), GE Vernova (GEV), Quanta Services (PWR), nVent (NVT), Powell (POWL), and Siemens Energy (ENR.DE) supply electrical and grid equipment; Cummins (CMI) and gas midstream names add fuel-cycle exposure. Many already carry premium valuations, so lead times, backlog quality, book-to-bill and customer concentration matter more than the narrative alone. Pre-revenue small-modular-reactor names such as Oklo (OKLO) and NuScale (SMR) are long-dated technology and regulatory options, not solutions to the current power shortage.
The thesis ends when the bottleneck is solved—or demand disappears
The trade breaks on a single event above all others: a hyperscaler cutting or pausing its 2027 capital-spending guidance, which would leave peak-priced turbine and transformer orders stranded and de-rate the entire electrical complex hard and fast. Short of that, an acceleration in interconnection-queue withdrawals would signal that the demand was partly speculative, and a genuine step-change in energy efficiency per token, of the kind a second efficiency shock in the models layer could produce, would soften the demand curve. And here is the paradox at the heart of owning this layer: faster grid and permitting reform, or a breakthrough in transformer and turbine manufacturing capacity, would relieve the scarcity that is the entire investment case. To be long the power bottleneck is to be long the problem staying unsolved.
The durable conclusion is therefore not simply that AI uses a great deal of electricity. It is that the market pays a premium to the companies that can move a project through the slowest part of the conversion chain. Today that chain often stops at interconnection, transformers, switchgear, turbines, and cooling. Those suppliers can enjoy unusual pricing power while orders exceed qualified capacity. Their advantage begins to fade when lead times shorten, new entrants qualify, customers delay projects, or regulators force a different allocation of grid cost.
A general investor should read the layer in this order: first verify that compute demand is producing funded sites; then verify that the site can obtain deliverable power; then identify which supplier owns the longest qualified lead time; finally compare the duration of that advantage with the valuation already paid for it. The engineering bottleneck creates the opportunity. The security return depends on buying that bottleneck before its scarcity, and not merely its importance, has been fully capitalized.
Chapter 2.3 endnotes
Sources
Linked evidence for this chapter's figures and load-bearing claims: 3 4 5 6
Footnotes
-
Energy and AI. International Energy Agency, 10 April 2025. The 2030 value is a projection. ↩
-
2024 United States Data Center Energy Usage Report. Lawrence Berkeley National Laboratory, December 2024. The 2028 value is a scenario range. ↩
-
ETN YTD Return. YTDReturn.com, undated; accessed 2026-07-25. ↩
-
VRT vs GEV Stock Comparison. PortfoliosLab, undated; accessed 2026-07-25. ↩
-
Transformers in 2026: Shortage, Scramble, or Self-Inflicted Crisis?. POWER, 2026-01-01; accessed 2026-07-25. ↩
-
5-year waits and rising costs: How demand is redefining the gas turbine market. Utility Dive, 2026-03-23; accessed 2026-07-25. ↩