Chapter 2.13 — From GPU to AI Factory: Four Supply-Chain Teardowns
The GPU is no longer the right accounting unit. An accelerator creates no economic output until memory feeds it, a network coordinates it, a cooling loop removes its heat, and a commissioned facility supplies reliable power. The investor must therefore follow value from package to system to facility—and stop whenever disclosure is too weak to support the next normalization.

Why the GPU is the wrong investment denominator
The AI-factory supply chain has three accounting boundaries, and an investor should never mix them. The accelerator package contains the compute dies, HBM and package-level interconnect. The complete system adds CPUs, scale-up switching, scale-out networking, power conversion, cooling distribution and physical integration. The 100 MW commissioned IT-nameplate facility adds upstream electrical and cooling plant, building works and recurring power, water and maintenance—but, in this model, excludes active IT. A rack price is therefore not a facility price, and a 160-cabinet SuperPoD is not comparable with a one-rack NVL72 until both are normalized to the same power boundary.
Five findings matter most.
-
The U.S. generation delta is bandwidth- and fabric-heavy, not GPU-count-heavy. GB300 NVL72 and Vera Rubin NVL72 both contain 72 GPUs and 36 CPUs and both expose 20.736 TB of GPU memory. Rubin raises rack HBM bandwidth from 576 to about 1,580 TB/s, NVLink bandwidth from 130 to 260 TB/s and scale-out bandwidth from 0.8 to 1.6 Tb/s per GPU. It also raises CPU memory from 17.28 to 54 TB. That shifts addressable content toward HBM4, host memory, switch silicon, networking and power-quality components without requiring more accelerators per rack.12
-
China’s next-generation disclosure is a scale-out roadmap, not yet a shipped like-for-like replacement. The installed Atlas 900 A3 is a 16-cabinet, 384-Ascend-910C system. Huawei physically demonstrated a 1,024-card Atlas 950 SuperPoD on 17 July 2026, but the separately disclosed roadmap maximum is 8,192 cards across 160 cabinets with a Q4 2026 target. The demo and the roadmap maximum are different configurations. Neither should be described as a currently shipping 8,192-card product.34
-
Power disclosure is the comparability gate. NVIDIA specifies up to 142 kW for GB300 NVL72. At an 80 MW compute allocation inside a 100 MW IT-nameplate facility, that supports about 563 racks, with 493–620 across the 70%–88% compute-share sensitivity. NVIDIA has not published Rubin rack power, and Huawei has not published complete-system power for the A3 or Atlas 950 configurations. No normalized system count is shown for those platforms.
-
The facility is a second BOM, not a rounding error. The modeled installed, facility-side capex for a 100 MW IT-nameplate site is $1.118–$1.814 billion in the United States and $0.661–$1.174 billion in China, with base cases of $1.372 billion and $0.895 billion. These are national benchmark cases, not quotes and not proof that any named supplier serves a platform. At the common base case of 1.25 PUE and 65% utilization, each site consumes about 711.75 GWh annually. Electricity is about $61.35 million per year in the U.S. base case and $60.15 million in the China base case; facility maintenance adds about $54.88 million and $35.80 million respectively.
-
Evidence quality and investability are different questions. A confirmed design-in may still offer poor public-market access; an accessible supplier may have unreported allocation; a roadmap may point to structural demand without supporting near-term revenue. The matrix at the end therefore separates content growth, access, evidence, customer concentration and substitution risk instead of collapsing them into a buy score.
Evidence status is displayed throughout as Confirmed, Reported, Inferred, Roadmap or Speculative. Confirmed and reported facts may enter calculations when their boundaries are compatible; inferred values enter only when the arithmetic is transparent; roadmap values remain forward-looking; speculative values never enter totals or investment comparisons.
Source quality is a separate dimension. A first-party product specification can be high-quality evidence that a vendor made a claim while the claim itself remains forward-looking; a reputable reported teardown can be a sound secondary source while the supplier relationship remains only “Reported.” The badges describe certainty of the relationship or value, not a score for the publisher.
How to read an AI-factory bill of materials
A bill of materials is not a supplier shopping list. It answers a narrower question: what else must a customer buy before one unit becomes a working product?
Think of a GPU as an engine. The engine matters, but a customer cannot drive it without a transmission, cooling, controls, a chassis, fuel, and roads. In the same way, an accelerator package needs memory and packaging; a compute system adds CPUs, fabrics, power conversion, and liquid cooling; a facility adds electrical distribution, cooling plant, construction, and recurring utilities.
The three BOMs answer different investment questions:
| Boundary | Everyday analogy | What it answers | What it cannot answer |
|---|---|---|---|
| Accelerator package | An engine | What changes in compute, HBM, substrate, and packaging | Whether a large system runs efficiently |
| Rack or SuperPoD | A complete vehicle | What the customer buys to receive usable compute | Total facility cost or systems per campus |
| 100 MW IT facility | Roads, depot, fuel, and maintenance | What physical infrastructure commissions those systems | How much revenue a named supplier must receive |
Moving outward makes the number larger and double counting easier. A cold plate or power shelf already included in the rack cannot be added again to the facility BOM. A facility substation cannot be assigned to one accelerator package. The boundary must be fixed before “content growth” has a useful meaning.
Why “not calculable” is a result
Research models often look more complete than their evidence. If a rack's power is disclosed, compute allocation divided by rack power can produce a normalized rack count. If another platform's system power is undisclosed, copying the prior generation or inserting a third-party estimate creates a precise-looking but false comparison.
“Not calculable” identifies:
- the missing denominator;
- the point where a directional conclusion can no longer enter a total;
- the next disclosure that will change the model;
- supplier categories that may benefit without supporting revenue allocation.
An explicit blank is more useful than a fictional decimal. The blank can later be filled from evidence; a weak number silently corrupts every table built on top of it.
More system content does not automatically mean more supplier revenue
Rubin's larger HBM bandwidth, scale-up fabric, host memory, and power-quality requirements establish category demand. Assigning that demand to a company requires four additional gates:
- the customer identifies or confirms the supplier;
- the product qualifies and enters volume production;
- the supplier receives an observable allocation and price;
- the resulting business is material to the supplier's profit.
A confirmed HBM4 design-in does not prove a 50% share. A cooling vendor in a reference architecture does not prove adoption at every campus. Where allocation is undisclosed, this chapter records the relationship without turning it into supplier revenue.
This is also why evidence certainty and investment upside can diverge. The platform owner and foundry may have the clearest relationships, while their valuations already reflect growth. A smaller component vendor may have greater earnings sensitivity but weaker allocation evidence and higher customer concentration.
Normalization gives different systems a common language
An NVL72 is one rack. Atlas 900 A3 is a 16-cabinet system. The Atlas 950 roadmap maximum is 160 cabinets. Comparing price, cabinet count, or accelerator count directly is like comparing a car with a train by asking which is larger: true but economically unhelpful.
The 100 MW boundary fixes IT nameplate, compute share, PUE, and utilization, then asks what physical capacity and facility cost each platform implies. System counts are calculated only when complete-system power is disclosed. Otherwise, only the common facility-side scenario is retained.
This normalization is not a procurement forecast. Real sites differ in redundancy, stranded capacity, hall geometry, environmental conditions, and workload. Its value is comparative: when every platform uses the same rules, the shift toward memory, networking, cooling, or electrical infrastructure becomes visible.
Walk from chip to grid before comparing the four systems
An accelerator becomes useful compute only after six nested physical layers work together. The opening anatomy is repeated here as a reading sequence: package, tray, rack, data hall, commissioned facility, then grid and resources.
| Layer | What is physically added | Principal constraint | Accounting treatment here |
|---|---|---|---|
| Accelerator package | Logic dies, HBM, substrate, package interconnect | Yield, HBM supply, advanced packaging | Platform BOM |
| Tray or board | CPUs, GPUs, local memory, NICs/DPUs, voltage conversion, cold plates | Signal integrity, power density, thermal transfer | Platform BOM |
| Rack / supernode | Scale-up switch trays, cabling, power shelves, manifolds, management | Fabric bandwidth, rack power, serviceability | Platform BOM |
| Data hall | Busway, CDUs and heat exchangers, row networking, physical deployment | Concurrent maintainability, hydraulic and electrical distribution | Facility BOM except active IT |
| Campus | Substation, switchgear, UPS/storage, generation, central cooling, shell | Interconnection lead time, water, construction and commissioning | Facility BOM |
| Grid | Generation and transmission outside the site boundary | Available capacity, price and delivery timing | Excluded remote grid works; electricity is recurring opex |
There are two flows. Electricity runs from grid connection to transformer and substation, medium-voltage switchgear, UPS or energy storage and standby generation, low-voltage distribution, busway and finally the rack power shelf. Heat runs in reverse: chip to cold plate, technology loop, CDU and heat exchanger, facility water loop, then chiller, dry cooler or cooling tower to ambient. The rack is the handoff point. A cold plate or power shelf shipped as part of the compute system belongs to the platform BOM; a facility-side CDU, busway or chiller belongs to the facility BOM. The physical architectures are described in the U.S. Department of Energy data-center design guide.
The chapter therefore reports three different answers for every platform:
- What is in one accelerator package?
- What is in the disclosed complete system boundary?
- What can be said at 100 MW commissioned IT nameplate without guessing?
For deeper treatment of generation, transmission, cooling and data-center constraints, see §2.3. Accelerator architecture belongs in §2.5; scale-up and scale-out fabrics in §2.6; HBM and advanced packaging in §2.7; foundry concentration in §2.8; equipment and EDA in §2.9; materials in §2.10; capital formation in §2.11; and export controls and stack bifurcation in §2.12. Company fundamentals, listings, and security-level access are evaluated in Part V.

| Anchor | Package boundary | Complete-system boundary | 100 MW normalization |
|---|---|---|---|
| Blackwell Ultra | One B300 package | One GB300 NVL72 rack | Supported from disclosed 142 kW rack maximum |
| Vera Rubin | One Rubin package | One Vera Rubin NVL72 rack | N/A: rack power undisclosed |
| Ascend 910C | One 910C accelerator | One 16-cabinet Atlas 900 A3 | N/A: system power undisclosed |
| Ascend 950DT | One 950DT roadmap accelerator | 1,024-card demonstration and separate 8,192-card roadmap maximum | N/A: both system powers undisclosed |
U.S. installed: Blackwell Ultra / GB300 NVL72
Identity and lifecycle. Confirmed · shipping NVIDIA announced Blackwell Ultra on 18 March 2025 and described GB300 NVL72 as available by the 25 July 2026 cutoff. The system boundary used here is one NVL72 compute rack: 72 Blackwell Ultra GPUs and 36 Grace CPUs. It does not include a surrounding data hall, external storage or campus networking. NVIDIA’s GB300 product page and launch announcement are the lifecycle anchors.
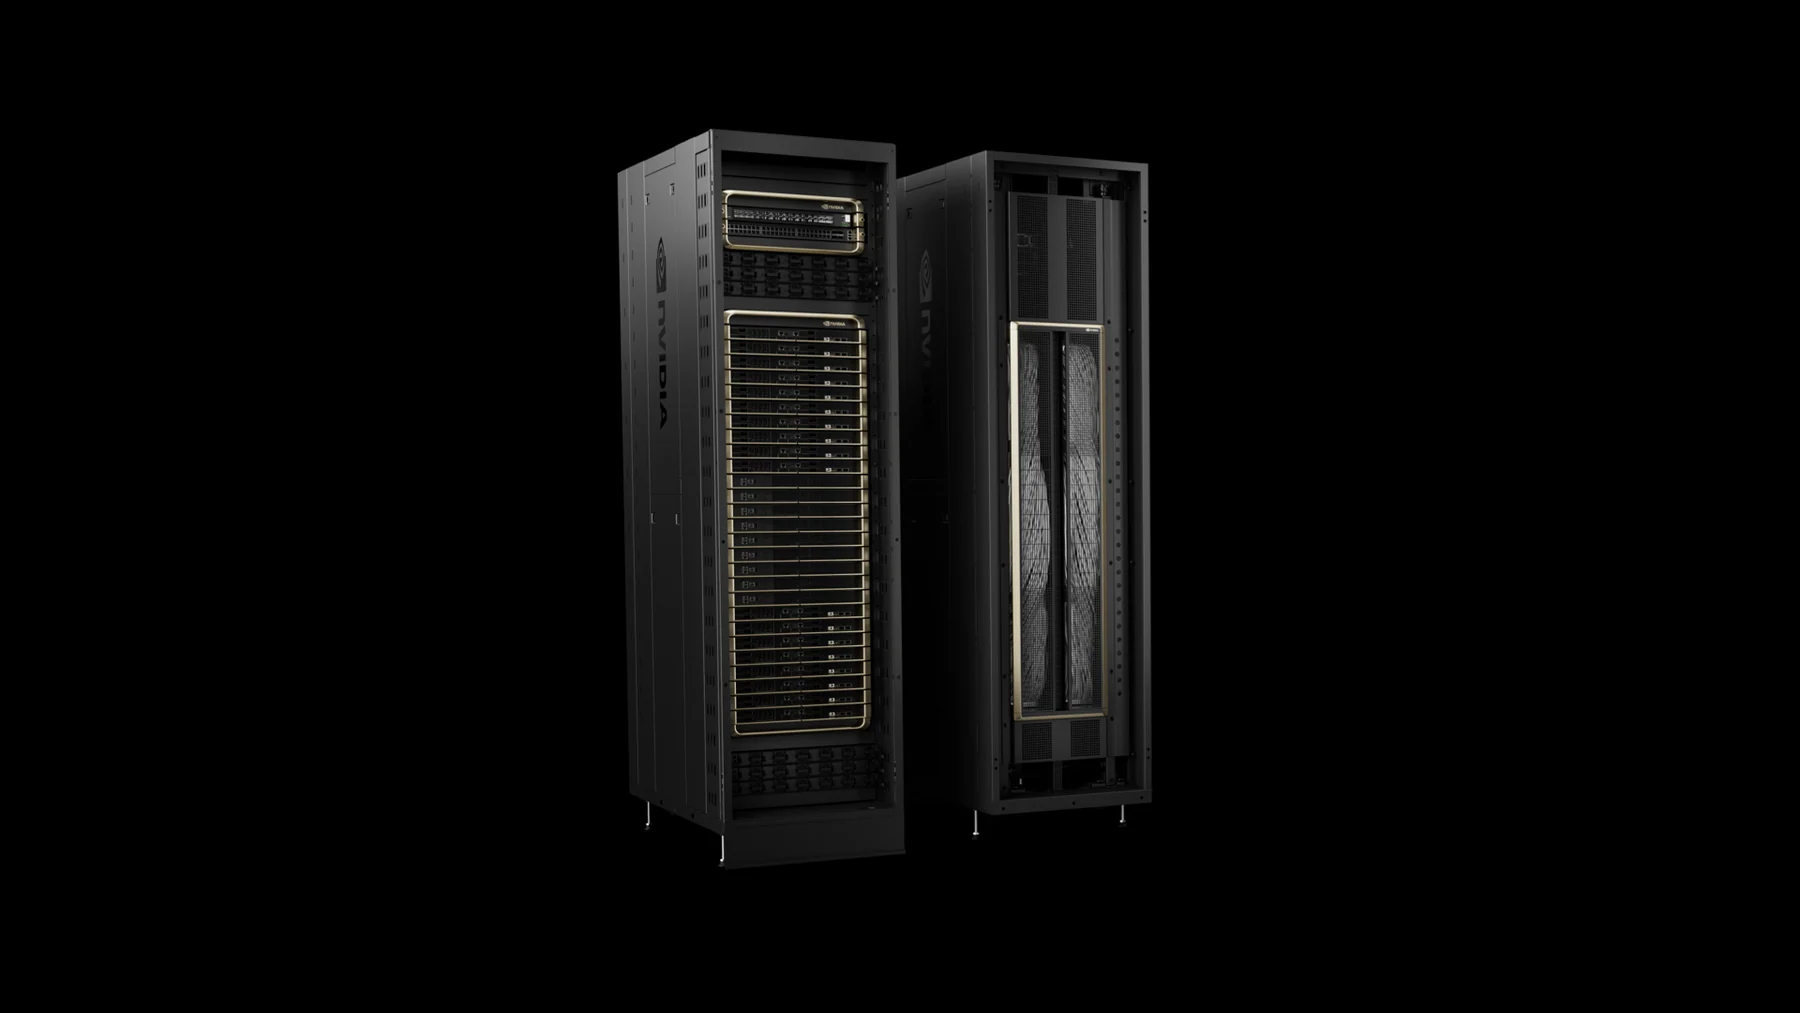
How 72 GPUs become a 142 kW rack
One Blackwell Ultra B300 is a unified package containing two reticle-limited compute dies linked by NVIDIA’s 10 TB/s NV-HBI. The disclosed package has 208 billion transistors, 288 GB of HBM3E in eight 12-high stacks, up to 8 TB/s of HBM bandwidth, 1.8 TB/s bidirectional NVLink 5 bandwidth and a maximum total graphics power of 1.4 kW. The 1.4 kW value is a ceiling for the GPU package, not an average rack-load assumption. NVIDIA identifies the process as TSMC 4NP. NVIDIA’s Blackwell Ultra architecture note supplies the package boundary.
The complete rack contains 18 compute trays, each with four GPUs and two Grace CPUs; nine NVSwitch trays with two NVSwitch ASICs each; 72 ConnectX-8 adapters; 18 BlueField-3 DPUs; and eight 33 kW power shelves. NVIDIA specifies up to 142 kW for the rack. Direct liquid cooling is part of the physical system boundary. NVIDIA’s GB300 reference architecture provides the tray and rack counts.
| GB300 boundary | Exact disclosed content | Evidence |
|---|---|---|
| One B300 package | 2 compute dies; 208B transistors; 288 GB HBM3E; 8 TB/s HBM; 1.8 TB/s NVLink; 1.4 kW maximum TGP | Confirmed |
| One compute tray | 4 B300 GPUs; 2 Grace CPUs; 4 ConnectX-8 adapters; 1 BlueField-3 DPU | Confirmed |
| One NVL72 rack | 18 compute trays; 72 GPUs; 36 CPUs; 9 switch trays; 18 NVSwitch ASICs | Confirmed |
| Rack power and cooling | Up to 142 kW; direct liquid cooling | Confirmed |
| Aggregate rack GPU memory | 20.736 TB | Inferred: 72 × 288 GB |
| Aggregate rack HBM bandwidth | 576 TB/s | Inferred: 72 × 8 TB/s |
Power disclosure makes GB300 the only platform that fits a 100 MW denominator
The base facility reserves 80 MW of its 100 MW IT nameplate for compute, with 10 MW for networking, 7 MW for storage and 3 MW for management and security. Dividing 80 MW by the disclosed 142 kW maximum rack load yields 563.38 GB300 NVL72 racks. A 70%–88% compute-share sensitivity produces 492.96–619.72 racks. These are engineering occupancy equivalents, not a procurement forecast: hall geometry, stranded capacity, maintenance reserve and actual utilization will reduce or redistribute deployable counts.
| 100 MW IT-nameplate case | Compute share | Compute power | GB300 power used | Normalized NVL72 racks |
|---|---|---|---|---|
| Low compute allocation | 70% | 70 MW | 142 kW maximum per rack | 492.96 |
| Base | 80% | 80 MW | 142 kW maximum per rack | 563.38 |
| High compute allocation | 88% | 88 MW | 142 kW maximum per rack | 619.72 |
The count does not include the cost of those racks in facility capex. Active accelerators, CPUs, memory, storage, rack networking, optics and active-IT spares are excluded from the 100 MW facility BOM.
Many suppliers are named; few revenue shares are disclosed
The current rack is globally manufactured even when final integration moves closer to U.S. demand. NVIDIA (NVDA) designs the platform. TSMC (TSM) fabricates Blackwell Ultra on 4NP; NVIDIA has separately confirmed Blackwell-family production at TSMC Arizona, but public evidence does not allocate GB300 wafer volume between Arizona and Taiwan. Micron Technology (MU) says its 36 GB 12-high HBM3E is designed into GB300 and that its SOCAMM memory was co-developed for the platform. SK hynix (000660.KS) has displayed a GB300 module using its 36 GB HBM3E. Foxconn (Hon Hai Precision, 2317.TW) identifies itself as a pilot-build supplier and its Ingrasys unit as a liquid-cooling design participant. Wistron (3231.TW) says its Fort Worth D1 plant mass-produces GB300 boards.
| Role | Named entity | Geography evidenced | Relationship | What is not evidenced |
|---|---|---|---|---|
| Platform design | NVIDIA | United States | Confirmed | Customer or geography mix |
| Logic fabrication | TSMC | 4NP confirmed; Arizona Blackwell-family production separately confirmed | Confirmed process | GB300 Arizona/Taiwan allocation |
| HBM3E / SOCAMM | Micron | U.S.-headquartered; manufacturing allocation not disclosed here | Confirmed design-in | Unit or revenue share |
| HBM3E | SK hynix | Korea-headquartered; manufacturing allocation not disclosed here | Confirmed module evidence | Unit or revenue share |
| Pilot build / cooling | Foxconn / Ingrasys | Taiwan-centered manufacturing network | Confirmed participation | Rack allocation |
| Board production | Wistron | Fort Worth, Texas | Confirmed | Platform-wide allocation |
The revenue window is open, but the value split is still being tested
For the current generation, the most direct commercial exposure is already in production: NVIDIA’s platform silicon and systems, HBM3E from named memory partners, TSMC 4NP wafers, switch and networking silicon within the NVIDIA rack, and board/system integration. The important qualification is allocation. Participation is confirmed; the percentage of GB300 units, wafers or HBM stacks supplied by each partner is not. The chapter therefore does not convert a design-in into supplier revenue.
The 12–36 month question is how long GB300 remains a volume bridge while Rubin ramps, and whether named memory and integration suppliers retain or expand content during the transition. The 3–7 year question is whether annual platform cadence makes each installed generation a short-lived revenue wave or expands the service, replacement, networking and facility-content pool enough to offset faster obsolescence.
The risks are customer concentration, synchronized supply, and rapid replacement
- The maximum 142 kW specification may exceed average operating draw, so normalized rack counts are conservative occupancy equivalents rather than energy forecasts.
- A confirmed supplier relationship does not establish supplier share, pricing or gross margin.
- TSMC Arizona production is a family-level statement; assigning a GB300 geographic share would overstate the evidence.
- Rapid Rubin adoption can compress the GB300 revenue window even while installed-base support and facility spending continue.
- Taiwan concentration, export controls and the capital cycle are cross-layer risks; see §§2.8, 2.11 and 2.12.
U.S. ramping: Vera Rubin / NVL72
Identity and lifecycle. Ramping · broad availability targeted H2 2026 NVIDIA said Rubin silicon was in full production in January 2026 and named system builders manufacturing Vera Rubin systems by 31 May 2026. Broad availability remained an H2 2026 milestone at the cutoff. “Ramping” is therefore more accurate than either “roadmap only” or “fully installed.” The boundary is one Vera Rubin NVL72 compute rack. NVIDIA’s broader five-rack POD adds separate Vera CPU, Groq 3 LPX, BlueField-4 STX and Spectrum-6 SPX racks; those companion racks are excluded from the NVL72 BOM below. NVIDIA’s Rubin launch and production-ramp announcement anchor the status.
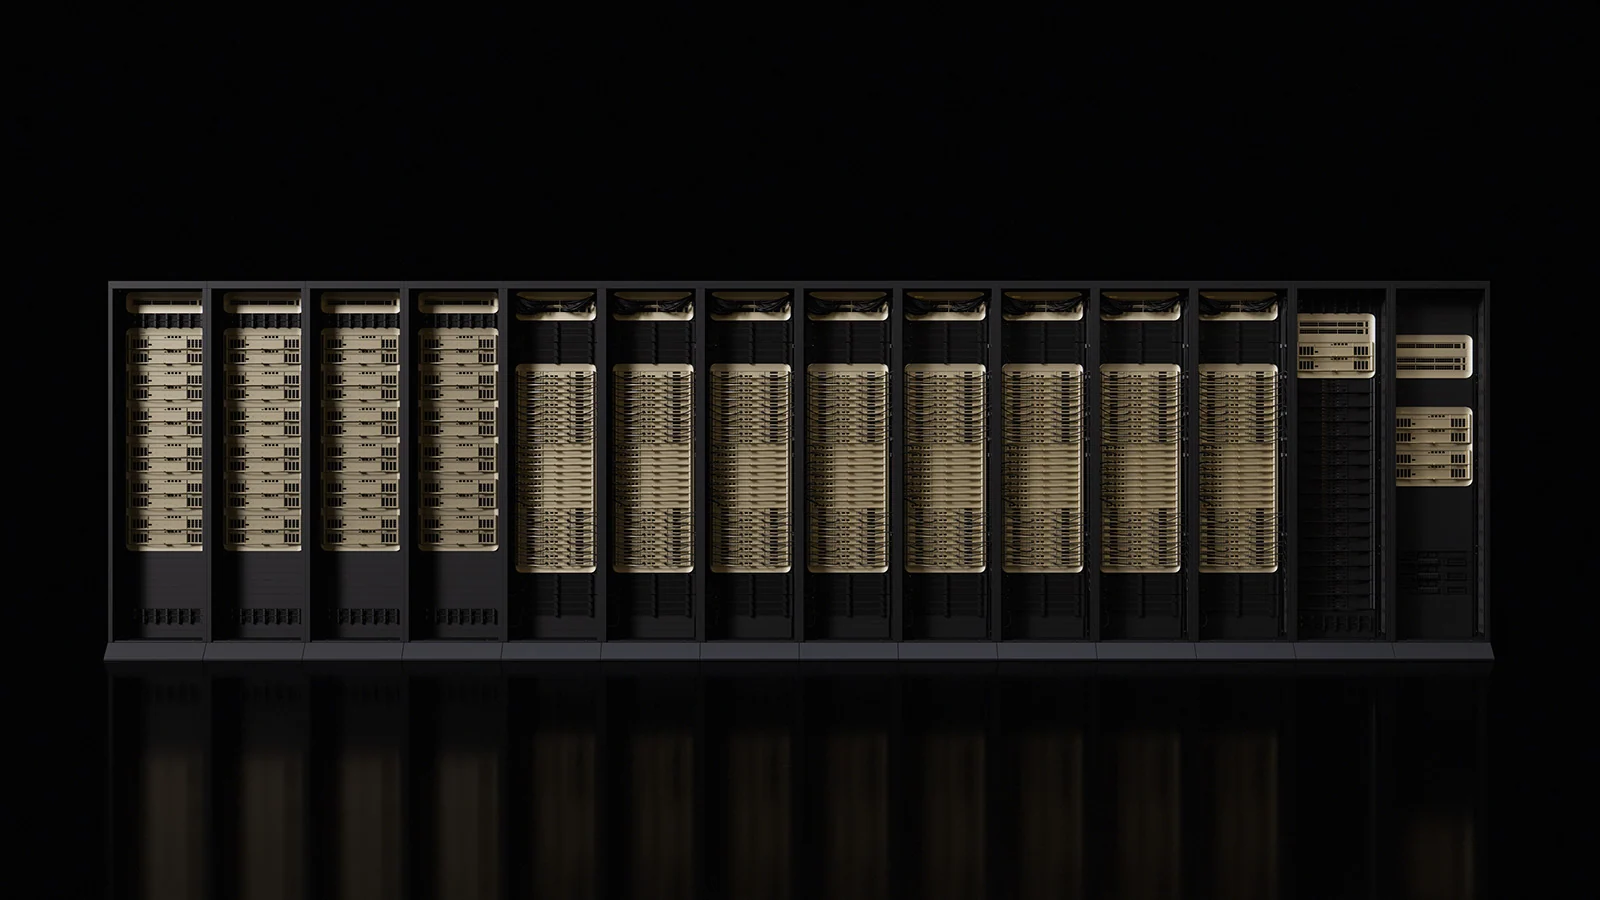
The GPU count is unchanged while memory and fabric rewrite the rack
One Rubin GPU contains two reticle-limited compute dies connected by NV-HBI. NVIDIA’s preliminary specification is 336 billion transistors, 288 GB of HBM4, 22 TB/s of HBM bandwidth, 50 PFLOPS of NVFP4 inference compute and 3.6 TB/s bidirectional NVLink 6 bandwidth. The process node, HBM stack count, package supplier and GPU TGP were not disclosed by the cutoff and remain blank rather than being populated from analyst reports. The Rubin GPU architecture note and Vera Rubin specification page define the package.
The rack preserves 72 GPUs and 36 CPUs. NVIDIA shows two Vera Rubin Superchips per compute tray, or four GPUs and two CPUs, implying 18 compute trays. It discloses 36 NVLink 6 switch ASICs and four ASICs per switch tray, implying nine switch trays. The 18- and nine-tray counts are arithmetic inferences, not separately published line items. The platform introduces BlueField-4, 1.6 Tb/s per-GPU scale-out connectivity, 45°C warm-water single-phase direct liquid cooling, rack-level power smoothing and roughly six times Blackwell Ultra’s local energy buffering. NVIDIA says thermal performance nearly doubles in the same footprint, but it does not publish a rack-kW value. NVIDIA’s platform architecture supports these relationships.
| Vera Rubin boundary | Exact or derived content | Evidence |
|---|---|---|
| One Rubin package | 2 compute dies; 336B transistors; 288 GB HBM4; 22 TB/s HBM; 3.6 TB/s NVLink | Preliminary first-party specification |
| One NVL72 rack | 72 Rubin GPUs; 36 Vera CPUs | Confirmed configuration |
| Compute trays | 18 | Inferred from 4 GPUs and 2 CPUs per tray |
| NVLink switch ASICs / trays | 36 ASICs / 9 trays | 36 disclosed; 9 inferred at 4 per tray |
| Rack GPU memory | 20.736 TB | 72 × 288 GB |
| Rack HBM bandwidth | About 1,584 TB/s; displayed as 1,580 in rounded platform comparison | 72 × 22 TB/s |
| Rack power | Not disclosed | N/A — no estimate enters totals |
Facility demand is visible; rack count is not
Rubin’s facility impact is directionally clear but not numerically normalizable at the system level. Warm-water liquid cooling can change heat-rejection design; power smoothing and larger local buffering add rack-level power-quality content; and doubled scale-up and scale-out bandwidth increase the networking burden. None of these disclosures supplies rack power. Reusing GB300’s 142 kW, or adopting a third-party Rubin estimate, would create a false systems-per-100-MW comparison. The normalized count is therefore N/A.
| Facility question | What the evidence supports | What remains unavailable |
|---|---|---|
| Cooling architecture | 45°C warm-water, single-phase direct liquid cooling; higher-flow manifold | Facility WUE, flow requirement and cooling-plant capex per rack |
| Power quality | Rack-level smoothing; about 6× Blackwell Ultra local energy buffering | Rack input power and buffering component value |
| Density | Nearly 2× thermal performance in the same rack footprint | Rack kW and hall-level deployable count |
| 100 MW normalization | Facility-side national cost and opex scenarios still apply | Number of Rubin NVL72 racks per 100 MW |
Qualification relationships arrive before volume revenue
NVIDIA names Dell Technologies (DELL), Hewlett Packard Enterprise (HPE), Lenovo (0992.HK), Super Micro Computer (SMCI), Foxconn, Quanta/QCT (2382.TW), Wistron and Wiwynn (6669.TW) among Vera Rubin system builders in production. This confirms participation, not share. Micron says 36 GB 12-high HBM4 and SOCAMM2 designed for Vera Rubin entered volume shipment from Q1 2026. Samsung Electronics (005930.KS) describes mass-production HBM4 and SOCAMM2 as designed for Vera Rubin. SK hynix describes a multi-year co-development and supply relationship with NVIDIA for Vera Rubin memory, but the cited disclosure does not allocate a specific Rubin HBM SKU. Wistron says its Fort Worth site will produce Vera Rubin Superchips.
| Role | Named entity or group | Relationship | Evidence boundary |
|---|---|---|---|
| Platform design and rack fabric | NVIDIA | Confirmed | Product specification; commercial allocation not applicable |
| HBM4 / SOCAMM2 | Micron | Confirmed design and volume shipment | Vera Rubin design-in; supplier share undisclosed |
| HBM4 / SOCAMM2 | Samsung | Confirmed design relationship | Supplier share undisclosed |
| Memory partnership | SK hynix | Reported co-development and supply | No cited SKU allocation |
| Superchip production | Wistron | Named future Fort Worth production | Volume and start date undisclosed |
| System building | Dell, HPE, Lenovo, Supermicro, Foxconn, QCT, Wistron, Wiwynn | Participation confirmed | No unit allocation |
| Foundry / package supplier | Not disclosed | N/A | No name enters exposure analysis |
Incremental value moves toward HBM4, host memory, and power quality
The strongest content-growth signals are inside the unchanged 72-GPU rack boundary. HBM bandwidth rises about 174%; NVLink rack bandwidth doubles; the switch-ASIC count doubles from 18 to 36; scale-out connectivity per GPU doubles; and host CPU memory rises from 17.28 TB to 54 TB. The likely beneficiaries are therefore the platform owner, qualified HBM4 and SOCAMM2 vendors, scale-up and scale-out silicon, high-speed interconnect components, power-smoothing hardware, liquid-cooling components and system integration. Only the named, disclosed relationships are attributed to companies; category demand is not converted into supplier revenue.
The near-term commercial window runs from memory qualification and system-builder production in 2026 through broad availability and customer deployment. The structural window is longer: hotter, more bandwidth-intensive racks pull facility electrical and cooling content forward and make networking a larger fraction of system value. The key risk for supplier modeling is cadence. Qualification can be economically meaningful before end-system volume, but an announcement date is not a revenue-recognition date.
The risks are roadmap synchronization and undisclosed power
- Published specifications are preliminary and can change before broad availability.
- No disclosed rack power means no rack count, power cost or active-IT capex per 100 MW.
- Foundry, package supplier, HBM allocations, system-builder shares and BlueField-4 count are undisclosed.
- A named design relationship does not reveal price, margin, duration or exclusive status.
- The five-rack Vera Rubin POD and one-rack NVL72 are different boundaries; blending them double-counts companion infrastructure.
China installed: Ascend 910C / Atlas 900 A3
Identity and lifecycle. Confirmed · shipping Ascend 910C is the accelerator; Atlas 900 A3 is the physical 16-cabinet SuperPoD; CloudMatrix384 is Huawei Cloud’s service deployment of the architecture, not a separate hardware BOM. Huawei reported more than 300 A3 SuperPoDs shipped to more than 20 customers by September 2025 and more than 750 commercial deployments by 17 July 2026. Vendor-reported deployment counts establish commercial status but are not an independently audited installed-base series. Huawei’s A3 product page, September 2025 launch disclosure and July 2026 update define the boundary and status.
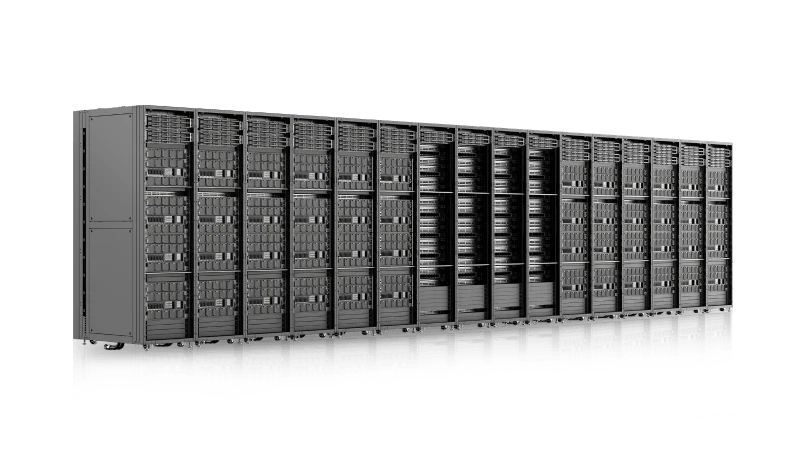
How 384 accelerators become a 16-cabinet system
The disclosed Ascend 910C package boundary is sparse: 128 GB of on-package memory per NPU and 3.2 TB/s of memory bandwidth. Huawei does not disclose HBM generation or supplier, die count, process node, packaging vendor, accelerator power or price. Reuters reported that Huawei sought SMIC N+2 production for the 910C; that relationship remains Reported, not confirmed allocation. Reuters reporting is therefore kept separate from Huawei’s product specifications.
The complete A3 comprises 12 liquid-cooled compute cabinets and four air-cooled bus cabinets: 384 Ascend 910C NPUs, 192 Kunpeng 920 CPUs, 1,536 DDR5 DIMMs and 480 2.5-inch drives. It exposes 48 TB of aggregate on-package memory, 784 GB/s bidirectional die-to-die bandwidth and 288.7–307.2 PFLOPS of FP16 compute, depending on the published operating/configuration range. The input architecture is dual three-phase 380 V AC. Total and per-cabinet power are not disclosed.
| Atlas 900 A3 boundary | Disclosed content | Evidence |
|---|---|---|
| One Ascend 910C | 128 GB on-package memory; 3.2 TB/s memory bandwidth | Confirmed |
| Physical system | 16 cabinets: 12 compute + 4 bus | Confirmed |
| Accelerators / CPUs | 384 Ascend 910C / 192 Kunpeng 920 | Confirmed |
| Host memory / storage | 1,536 DDR5 DIMMs / 480 2.5-inch drives | Confirmed counts |
| Aggregate on-package memory | 48 TB | Published aggregate; reconciles with 384 × 128 GB |
| FP16 compute | 288.7–307.2 PFLOPS | Published range |
| Cooling | Liquid-cooled compute cabinets; air-cooled bus cabinets | Confirmed |
| System power | Not disclosed | N/A |
Deployed does not mean normalized
The A3 is commercially deployed, but deployment status does not solve the normalization problem. Without total system power, a 16-cabinet footprint cannot be converted into systems per 100 MW. Nor can cabinet count stand in for power: four cabinets are bus cabinets, cooling modes differ, and the disclosed input voltage does not reveal load. The honest 100 MW result is N/A.
The national China facility case still describes the surrounding commissioned infrastructure. A base 100 MW IT-nameplate facility has 125 MW gross design demand at 1.25 PUE, consumes about 711.75 GWh annually at 65% utilization, and carries modeled facility-side capex of $894.92 million. Those values do not determine how many A3 systems fit inside the compute allocation.
The domestic system is visible; external supplier relationships are not
Huawei and its HiSilicon design arm own the accelerator and system architecture; Kunpeng is also a Huawei processor family. The current architecture therefore concentrates visible design and platform value inside a private, inaccessible-to-most-investors corporate group. SMIC’s foundry relationship is reported, not confirmed by a platform allocation. Huawei does not identify the memory, advanced-packaging, optics, storage, liquid-cooling or manufacturing suppliers in the cited product disclosures.
| Role | Named entity | Relationship | Investment-access implication |
|---|---|---|---|
| Accelerator and system design | Huawei / HiSilicon | Confirmed | Huawei is private; direct public-equity access is unavailable |
| Host CPU | Huawei Kunpeng | Confirmed | Same concentrated private platform exposure |
| Logic fabrication | SMIC (0981.HK / 688981.SS) | Reported for 910C | Public access exists, but platform allocation is not confirmed |
| On-package memory | Not disclosed | N/A | No supplier attribution |
| Packaging, optics and cooling | Not disclosed | N/A | Category demand is visible; company allocation is not |
Investment value depends first on utilization and visible supplier revenue
The installed A3 base supports current demand for Huawei-designed accelerators, Kunpeng CPUs, large DDR5 and storage counts, bus-cabinet interconnect, liquid cooling and system integration. Yet the disclosed supplier map ends quickly. The most investable-looking external link—SMIC—is also the least certain named link in the platform record because it is reported rather than confirmed and carries no disclosed allocation.
For the next 12–36 months, the commercially relevant evidence is the reported deployment base and continued domestic substitution. For the 3–7 year horizon, the architecture demonstrates a Chinese path that compensates for weaker individual accelerators through system scale and a tightly controlled fabric. That can enlarge domestic memory, optics, packaging and cooling demand, but it does not identify which listed supplier captures it. Supplier qualification, localization policy and Huawei procurement disclosures are more useful leading indicators than a top-down market-share assumption.
Power, yield, software, and disclosure risks compound
- Huawei-reported deployments are not an audited installed-base measure.
- The package process, memory supplier, packaging chain, system power and price are undisclosed.
- Reported SMIC participation cannot be treated as confirmed supplier allocation.
- U.S. Bureau of Industry and Security guidance specifically addressed Ascend 910C in May 2025, increasing policy and transaction risk; see BIS General Prohibition 10 guidance and §2.12.
- A3’s 16-cabinet system cannot be compared directly with an NVL72 rack or Atlas 950 roadmap maximum.
China next: Ascend 950DT / Atlas 950 SuperPoD
Identity and lifecycle. Roadmap with physical 1,024-card demonstration Ascend 950DT is the Q4 2026 accelerator target. Atlas 950 is a family of system configurations. Huawei showed a physical 1,024-card Atlas 950 SuperPoD at the World Artificial Intelligence Conference on 17 July 2026. Separately, it describes an 8,192-card, 160-cabinet roadmap maximum targeted for Q4 2026. The demonstrated system and roadmap maximum are not interchangeable. As of the cutoff, the 1,024-card system was demonstrated; the 8,192-card maximum was not shipping. Huawei’s WAIC disclosure and 2025 roadmap keynote anchor the distinction.
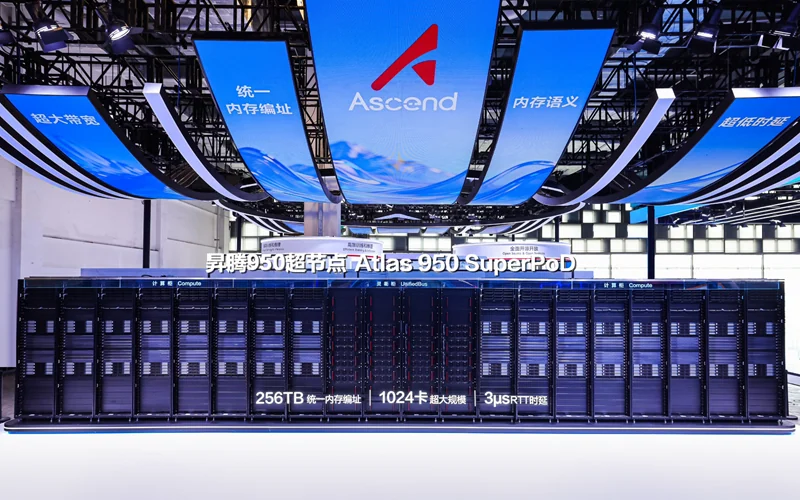
Separate the chip roadmap, 1,024-card demonstration, and 8,192-card target
Huawei’s Ascend 950DT roadmap specifies 144 GB of HiZQ 2.0 HBM, 4 TB/s of memory bandwidth, 2 TB/s of interconnect bandwidth per chip, 1 PFLOPS FP8 and 2 PFLOPS FP4. Process node, die count, package supplier, HBM manufacturer, package power and price remain undisclosed.
The July 2026 physical demonstration used 1,024 accelerator cards and disclosed 1 EFLOPS FP8, 2 EFLOPS FP4, 256 TB of globally addressed memory, terabyte-class NPU interconnect and 3 μs round-trip latency. The exact accelerator-card variant was not disclosed. The memory figure is an important reconciliation warning: 256 TB divided by 1,024 cards equals 256 GB per card, which does not match the separate 144 GB 950DT package roadmap. The demonstration is therefore stored as its own configuration rather than silently labeled “1,024 × 950DT.”
The roadmap maximum is 8,192 accelerator cards across 160 cabinets and more than 1,000 square metres: 128 compute cabinets at 64 cards each plus 32 communications cabinets. Huawei describes an all-optical UnifiedBus fabric, 8 EFLOPS FP8, 16 EFLOPS FP4, 1,152 TB of aggregate memory and roughly 16.3 PB/s of interconnect bandwidth. Cooling, system power, CPUs, host memory, storage, exact optics counts and system price are not disclosed.
| Atlas 950 boundary | Disclosed content | Status |
|---|---|---|
| Ascend 950DT package roadmap | 144 GB HiZQ 2.0 HBM; 4 TB/s memory; 2 TB/s interconnect; 1 PF FP8; 2 PF FP4 | Q4 2026 roadmap |
| Physical demonstration | 1,024 cards; 1 EF FP8; 2 EF FP4; 256 TB global memory; 3 μs RTT | Demonstrated 17 July 2026 |
| Demonstration card identity | Not disclosed; 256 GB/card implied by aggregate memory | Do not label as 950DT |
| Roadmap maximum | 8,192 cards; 160 cabinets; >1,000 m²; 1,152 TB memory | Q4 2026 target |
| Roadmap fabric | 128 compute + 32 communications cabinets; all-optical UnifiedBus; ~16.3 PB/s | Roadmap |
| System power and cooling | Not disclosed | N/A |
Physical scale is visible; facility economics are not
The roadmap’s more-than-1,000-square-metre footprint and 160 cabinets show that the system is campus-scale relative to a rack, but floor area is not an energy denominator. Without accelerator-card, cabinet or total-system power, neither the 1,024-card demonstration nor the 8,192-card roadmap maximum can be converted into systems per 100 MW. A power estimate would propagate into cooling, electrical capex, annual energy and supplier content, multiplying one unsupported assumption across the whole model. All such outputs remain N/A.
| Configuration | Physical evidence | 100 MW result |
|---|---|---|
| 1,024-card demonstration | Real hardware shown; exact card variant and total power undisclosed | N/A |
| 8,192-card roadmap maximum | Cabinet, area, memory, compute and interconnect targets disclosed; not shipping | N/A |
| China base facility | $894.92M facility-side capex; 125 MW gross design; 711.75 GWh/year at common base assumptions | Valid national benchmark, but cannot yield Atlas 950 system count |
Category demand is large while named external-supplier evidence is weakest
Huawei owns Ascend design, HiZQ branding and UnifiedBus architecture. That establishes architectural control, not the manufacturing chain behind them. The HBM fabricator, foundry, advanced-packaging provider, optical transceiver and component suppliers, cooling vendors and final system manufacturers were not publicly allocated in the cited disclosures. No outside supplier is therefore assigned Atlas 950 revenue or share.
| Role | Named entity | Evidence | What remains open |
|---|---|---|---|
| Accelerator and system design | Huawei / HiSilicon | Roadmap owner | Manufacturing allocation |
| HBM architecture/brand | Huawei HiZQ 2.0 | Roadmap specification | Memory fabricator and packaging chain |
| Scale-up fabric | Huawei UnifiedBus | Architecture owner confirmed | Actual optics, cable and switch-component suppliers |
| Foundry | Not disclosed | N/A | Process, location, yield and allocation |
| Cooling and system integration | Not disclosed | N/A | Vendors, topology, power and economics |
Content growth is not yet near-term investable revenue
Against the A3 package, the 950DT roadmap raises memory capacity from 128 to 144 GB, a 12.5% increase, and bandwidth from 3.2 to 4 TB/s, a 25% increase. At the published complete-system extremes, accelerators rise from 384 in A3 to 8,192 in the Atlas 950 roadmap maximum, cabinet count rises from 16 to 160, and aggregate memory rises from 48 to 1,152 TB. These 21.33×, 10× and 24× ratios describe disclosed configuration boundaries; they are not a shipment forecast.
The demand direction is toward much more accelerator silicon, HBM capacity, optical scale-up connectivity, power conversion and liquid cooling per deployed maximum-size system. “Who gets paid” is unresolved beyond Huawei because external suppliers are unnamed. The near-term catalyst is qualification and actual delivery against the Q4 2026 target; the structural question is whether UnifiedBus and domestic memory/packaging capacity can scale with acceptable yield, power and cost. Investors should require evidence of purchase orders, supplier qualification or recognized revenue before mapping category growth to a listed vendor.
The central risk is mistaking roadmap scale for delivery capacity
- The 1,024-card demonstration and 8,192-card roadmap maximum are different systems; merging them creates a false shipping claim.
- The demonstration’s implied 256 GB per card does not reconcile with the 950DT’s separately disclosed 144 GB, so the card identity remains unknown.
- System power, cooling topology, CPU and storage counts, foundry, HBM supplier, packaging provider and optics allocation are undisclosed.
- Q4 2026 is a roadmap target, not evidence of volume shipment.
- Export controls may slow domestic manufacturing inputs while simultaneously strengthening localization demand; see §§2.9, 2.10 and 2.12.
The next generation moves money toward bandwidth and systems
The generation delta is more useful than a static BOM because it identifies where addressable content is growing before supplier shares are known. It also exposes the asymmetry between the ecosystems. NVIDIA keeps the accelerator count fixed and intensifies memory, fabric, host memory, cooling and power quality inside one rack. Huawei’s disclosed next step expands both the package and the maximum system boundary, but leaves more of the manufacturing and power chain undisclosed.

| Ecosystem metric | Current | Next | Delta | Evidence and comparability |
|---|---|---|---|---|
| U.S. GPUs per NVL72 | 72 | 72 | 0% | Same one-rack boundary |
| U.S. GPU memory per rack | 20.736 TB | 20.736 TB | 0% | Same capacity; HBM3E → HBM4 |
| U.S. HBM bandwidth per rack | 576 TB/s | ~1,580 TB/s | +174.3% | Derived from disclosed per-GPU values; next rounded |
| U.S. NVLink bandwidth per rack | 130 TB/s | 260 TB/s | +100% | Platform comparison |
| U.S. scale-out bandwidth | 0.8 Tb/s/GPU | 1.6 Tb/s/GPU | +100% | Platform comparison |
| U.S. NVLink switch ASICs | 18 | 36 | +100% | Current disclosed; next disclosed count |
| U.S. CPU memory | 17.28 TB | 54 TB | +212.5% | Same rack boundary |
| U.S. rack power | Up to 142 kW | N/A | N/A | No Rubin rack-power disclosure |
| China package memory | 128 GB | 144 GB | +12.5% | 910C actual vs 950DT roadmap |
| China package memory bandwidth | 3.2 TB/s | 4 TB/s | +25% | 910C actual vs 950DT roadmap |
| China accelerators per compared system | 384 | 8,192 | 21.33× | A3 shipping vs Atlas 950 roadmap maximum; not a unit-sales forecast |
| China cabinet count | 16 | 160 | 10× | Same caution: current vs roadmap maximum |
| China aggregate accelerator memory | 48 TB | 1,152 TB | 24× | Current vs roadmap maximum |
| China system power | N/A | N/A | N/A | No normalized comparison |
Three investment readings follow. First, capacity can stay flat while content rises: Rubin’s unchanged GPU count masks large increases in bandwidth, switching and host memory. Second, system scale is itself a strategy: Huawei’s roadmap uses many more cards and an all-optical fabric to create a competitive aggregate system. Third, disclosure quality determines model quality: the apparently larger China delta cannot be converted into facility demand or supplier revenue until power and allocations are published.
Beyond the rack sits a billion-dollar facility BOM
The common facility boundary is 100 MW of commissioned IT nameplate. Low, base and high scenarios use 1.15, 1.25 and 1.35 PUE and 50%, 65% and 80% utilization. Gross design power is therefore 115, 125 and 135 MW, while annual energy is 503.70, 711.75 and 946.08 GWh. The physical ranges are held constant across the U.S. and China to avoid embedding an unsupported efficiency advantage. National differences enter through construction, electricity and water costs.

| 100 MW IT-nameplate metric | United States low / base / high | China low / base / high | Interpretation |
|---|---|---|---|
| Installed facility-side capex | $1,118.15M / $1,371.87M / $1,814.12M | $660.71M / $894.92M / $1,174.05M | Excludes land, active IT, taxes and financing |
| Gross design power | 115 / 125 / 135 MW | 115 / 125 / 135 MW | IT nameplate × PUE |
| Annual site energy | 503.70 / 711.75 / 946.08 GWh | 503.70 / 711.75 / 946.08 GWh | Gross power × utilization × 8,760 hours |
| Electricity | $25.19M / $61.35M / $132.45M | $25.54M / $60.15M / $106.60M | National/regional price sensitivities |
| Direct water volume | 87,600 / 256,230 / 490,560 m³ | Same physical range | WUE 0.2 / 0.45 / 0.7 L/kWh of IT energy |
| Water and wastewater | $0.18M / $0.90M / $3.92M | $0.03M / $0.22M / $0.66M | Cost is small relative to power; availability can still bind |
| Facility maintenance | $22.36M / $54.88M / $108.85M | $13.21M / $35.80M / $70.44M | 2% / 4% / 6% of installed facility capex |
| Normalized systems | GB300 only: 492.96 / 563.38 / 619.72 racks across compute-share sensitivity | N/A | Other platform power is undisclosed |
The base facility capex is a leaf-only sum, preventing the common error of adding subtotals to their children.
| Base facility-side capex leaf | United States | China |
|---|---|---|
| Electrical plant | $567.672M | $370.312M |
| Cooling plant | $390.275M | $254.589M |
| Shell and architectural | $106.439M | $69.433M |
| Contractor preliminaries and fees | $118.265M | $77.148M |
| Utility extension allowance | $94.612M | $61.719M |
| Owner, commissioning and facility-spares allowance | $94.612M | $61.719M |
| Total | $1,371.874M | $894.920M |
The cost gap is a benchmark-geography result, not evidence that a U.S. or Chinese facility is operationally superior. Construction benchmarks are especially sensitive to region, labor market, utility scope and procurement timing. The model uses the Turner & Townsend 2025 cost-index methodology and liquid-cooling allocation, and the Cushman & Wakefield APAC construction guide for the China range. PUE and utilization bounds are anchored to LBNL’s U.S. data-center energy report, Chinese national efficiency disclosures and Uptime Institute’s giant-data-center analysis.
A roadmap must clear several gates before it becomes supplier revenue
Supplier evidence arrives in a sequence. Architecture announcements create category demand; qualification or design-in identifies a potential supplier; manufacturing start establishes physical participation; shipment establishes a commercial product; customer commissioning creates utilization and recurring facility opex; reported revenue finally establishes economic capture. Most public supply-chain claims stop somewhere before the final step.

| Evidence stage | U.S. current / next examples | China current / next examples | What an investor may conclude |
|---|---|---|---|
| Architecture / roadmap | Rubin HBM4, NVLink 6, warm-water cooling; H2 2026 availability target | 950DT and 8,192-card Atlas 950 Q4 2026 targets | Directional category demand only |
| Design-in / qualification | Micron and Samsung describe Vera Rubin memory designs; SK hynix relationship reported | HiZQ and UnifiedBus are Huawei architectures; external suppliers unnamed | Named participation only where explicitly disclosed |
| Manufacturing | GB300 Wistron Fort Worth production; Vera Rubin system builders named | A3 commercially deployed; Atlas 950 physical 1,024-card demonstration | Product exists or is entering build; no supplier share |
| Shipment / availability | GB300 shipping; Rubin ramping toward broad availability | A3 shipping; 8,192-card Atlas 950 not shipping | Revenue window may be open, but value and allocation remain unknown |
| Commissioning / utilization | Customer-specific deployment not modeled | >750 A3 deployments reported by Huawei | Installed status; no inference to useful throughput |
| Recognized supplier revenue | Not provided at platform-line level in this dataset | Not provided at platform-line level in this dataset | Requires filings or supplier disclosure; do not back-solve from BOM counts |
The timing discipline prevents two errors. A roadmap designation is not backlog, and a confirmed design-in is not a revenue-share estimate. For the 12–36 month horizon, watch component qualification, manufacturing starts, broad availability, system power disclosure and commissioned deployments. For the 3–7 year horizon, watch whether memory, networking and facility content keep rising faster than accelerator counts, and whether domestic Chinese suppliers become visible enough to separate category growth from economic capture.
The most certain supplier relationship is not always the best security
The matrix below is a screening tool, not a recommendation. “Access” asks whether an investor can obtain direct public-equity exposure. “Evidence” asks whether the platform relationship is documented. “Concentration” asks how dependent the exposure is on one customer or platform. “Substitution” asks how readily another qualified supplier or architecture could take the content. None of these dimensions should be averaged into an opaque composite.

| Exposure | 12–36 month catalyst | 3–7 year structural position | Public-market access | Platform evidence | Concentration / substitution risk |
|---|---|---|---|---|---|
| NVIDIA platform silicon, NVLink and networking | GB300 shipments; Rubin broad availability and production ramp | Integrated rack architecture can capture a larger system BOM | Direct: NVDA | High for both U.S. anchors | High platform concentration; architectural substitution is difficult inside NVL72 but customer alternatives exist |
| U.S. HBM and SOCAMM — Micron | GB300 HBM3E/SOCAMM and Rubin HBM4/SOCAMM2 design-ins | Memory bandwidth and host-memory content grow faster than GPU count | Direct: MU | High for named design-ins; allocation unknown | Cyclical memory pricing; Samsung and SK hynix substitution |
| Korean HBM — SK hynix and Samsung | GB300 module evidence; Rubin relationships and designs | HBM4 complexity, bandwidth and capacity raise value per system | Direct in Korea | Mixed high/reported; allocation unknown | Multi-sourcing, qualification timing and memory-cycle risk |
| TSMC leading-edge fabrication | Confirmed GB300 4NP demand | Advanced logic and packaging remain difficult to substitute | Direct: TSM / 2330.TW | High for GB300; Rubin foundry undisclosed | Extreme customer and Taiwan concentration; process leadership lowers substitution |
| U.S./Taiwan system builders | GB300 production and Rubin manufacturing ramp | More system-level integration, cooling and power content | Direct through named listed builders | Participation high; unit shares unknown | Low transparency and potentially substitutable assembly capacity |
| Facility electrical and cooling categories | 100 MW projects require about $958M of electrical plus cooling plant in the U.S. base case; $625M in China | Denser liquid-cooled systems deepen grid-to-chip content | Access through Part V category screens | Provider-neutral facility evidence; no platform supplier attribution | Project timing, regional pricing, customer concentration and vendor competition |
| Huawei / HiSilicon platform | A3 installed base; Atlas 950 delivery against roadmap | Domestic full-stack control and UnifiedBus ecosystem | No direct public equity; Huawei private | High for architecture, low for external allocation | Extreme single-platform concentration; policy support and policy risk coexist |
| SMIC reported 910C fabrication | Evidence of continued current-generation production would be the catalyst | Domestic leading-edge substitution has strategic value | Direct: 0981.HK / 688981.SS | Reported, not confirmed allocation | Yield, tools, export controls and customer concentration |
| China memory, packaging, optics and cooling categories | Supplier qualification or purchase-order disclosure | Atlas-scale systems could expand domestic content sharply | Potentially accessible, but no issuer is assigned here | Low / undisclosed | High attribution risk; do not equate category demand with issuer revenue |
The highest-evidence U.S. exposures are also the most obvious and often the most concentrated. The largest apparent China content delta has the weakest external-supplier disclosure and the least direct access. That is not a reason to ignore it; it is a reason to demand a higher evidence threshold. Part V should be used to test valuation, liquidity, listing access, and company-specific risks after this physical screen.
How to turn the teardown into an investment hypothesis
A bill of materials is a map of physical demand, not a stock-selection answer. The path from “this component is needed” to “this security can earn an attractive return” has five separate steps.
- Find the category delta. Ask what grows from the current platform to the next one: accelerator count, memory capacity, optical links, switch bandwidth, liquid-cooling duty, rack power or facility electrical capacity. A flat GPU count does not mean a flat BOM if memory and networking content rise.
- Identify the economically qualified supplier. Architecture documents establish demand for HBM, optics or cooling. They do not establish which company has passed qualification, how much of the order it receives or whether it supplies a high-value component rather than a replaceable subassembly.
- Locate the revenue clock. A supplier can announce a design win quarters before manufacturing, and manufacturing can begin before the customer commissions a usable cluster. The relevant catalyst may therefore be qualification, production, shipment, commissioning or reported revenue, depending on where the company sits in the chain.
- Test financial materiality. Estimate the platform-related content that could accrue to the supplier, then compare it with company revenue, gross profit, capital spending and existing customer concentration. A large AI-factory category can still be immaterial to a diversified supplier; a modest category can transform a small specialist.
- Compare the result with expectations and failure modes. Valuation must already imply some combination of volume, price, market share and margin. The thesis fails if qualification slips, the customer dual-sources, useful utilization disappoints, facility power arrives late or the security price discounts more success than the business can deliver.
The four teardowns produce different starting hypotheses. In the U.S. path from GB300 to Vera Rubin, the most visible delta is not more accelerators per rack but more memory bandwidth, switch capacity, host memory, power density and cooling complexity around the same 72-GPU configuration. That favors a search for content growth around the accelerator, but the named suppliers are widely followed and allocation remains partly undisclosed. The investment question is therefore whether their incremental earnings sensitivity exceeds what the market already expects.
In the China path from Atlas 900 A3 to Atlas 950, the roadmap points to a much larger aggregate system and a more ambitious optical fabric. Yet its power boundary, external supplier list, allocations and maximum-system operating evidence are not sufficiently disclosed for a 100 MW revenue model. The investable conclusion is narrower: the architecture identifies categories that could become strategically important, while future qualification, procurement and commissioning disclosures must identify who captures the economics.
This distinction is the chapter’s central discipline. Use the normalized BOM to discover where physical content may migrate; use the evidence ladder to decide what can be underwritten now; then use Part V to determine whether a public security offers access at a price that leaves room for error.
The next questions for investors
The following disclosures would materially improve the model:
- What is Vera Rubin NVL72’s maximum and typical rack input power, and what boundary does each figure use?
- Which foundry process and advanced-packaging flow produce Rubin, and what is the geographic allocation?
- What are the Rubin HBM4 allocations among Micron, Samsung and SK hynix, and when do qualified shipments become recognized platform revenue?
- How many BlueField-4 devices, power shelves and local energy-buffering modules are in one Vera Rubin NVL72?
- What are Atlas 900 A3 total and per-cabinet power, cooling flow, optics counts and supplier allocations?
- Which accelerator card was used in the 1,024-card Atlas 950 demonstration, and why does its implied 256 GB per card differ from the 144 GB 950DT roadmap?
- What is the power, cooling topology and active component count of the 8,192-card Atlas 950 maximum?
- Who fabricates and packages Ascend 950DT and HiZQ 2.0 memory, and which optical suppliers qualify for UnifiedBus?
- At the facility layer, how much regional variation sits behind national construction and electricity cases, and which costs are customer-direct rather than contractor-delivered?
- How do useful training and inference throughput per commissioned megawatt compare once software, utilization and model workload are held constant?
The last question requires a separate workload and software benchmark, so it sits outside this physical supply-chain model. A common 100 MW denominator normalizes physical occupancy and facility economics; it does not normalize useful compute, model quality or revenue.
Boundaries that keep the comparison honest
- Cutoff and lifecycle: evidence is frozen at 25 July 2026. Status labels describe that date, not a timeless product state.
- System boundaries: GB300 and Vera Rubin use one NVL72 compute rack. Atlas 900 A3 uses one 16-cabinet SuperPoD. Atlas 950 retains separate 1,024-card demonstrated and 8,192-card roadmap-maximum configurations.
- Evidence policy: confirmed, reported and transparently inferred values may appear in factual tables. Roadmap values appear only with a roadmap label. Speculative values never enter totals, deltas or the investability matrix.
- Ranges: low/base/high values express scenario uncertainty, not statistical confidence intervals.
- Facility scope: included capex runs from site transformer/substation boundary through electrical distribution, facility-side cooling and heat rejection, shell/core, contractor costs, utility extension allowance, owner costs, commissioning and facility spares.
- Excluded from facility capex: land, taxes, financing, remote grid works, active accelerators, CPUs, memory, storage, rack networking, optics, rack cold plates, active-IT spares and project revenue.
- Recurring scope: electricity, direct water and routine facility maintenance are modeled separately. Active-IT service contracts, depreciation and major mid-life renewal are excluded.
- Physical assumptions: compute share is 70%/80%/88%; PUE is 1.15/1.25/1.35; utilization is 50%/65%/80%; direct WUE is 0.2/0.45/0.7 litres per kWh of IT energy. Critical-support capacity ratios of 1.0×/1.1×/2.0× describe design sensitivity and are not multiplied into capex a second time.
- Currencies: facility outputs are presented in U.S. dollars. China electricity and construction inputs are translated using the documented model FX convention; they are scenarios, not forecasts of exchange rates.
- Supplier allocation: a named participant, design-in or manufacturing site does not imply exclusivity, unit share, price or margin.
- Investment use: this is supply-chain and investment research, not personalized investment advice.
How to audit the evidence
Each displayed value maps to a platform state, system configuration, BOM line, facility assumption, supplier relationship, and public source. Derived values retain their formulas and dependencies. Facility totals use leaf rows only, avoiding double counting of subtotals; capex and opex remain separate; system counts require disclosed system power; supplier shares remain blank when undisclosed.
Facts and status labels are observed through 25 July 2026. Core first-party anchors are NVIDIA’s GB300 and Vera Rubin product and architecture disclosures, Huawei’s Atlas 900 A3 and Atlas 950 disclosures, the DOE facility design guide, LBNL and Chinese national efficiency sources, Turner & Townsend and Cushman & Wakefield construction benchmarks, EIA and Chinese electricity sources, EPA and municipal water tariffs, and GAO/NASA maintenance benchmarks. Reuters is used only where a relationship is explicitly labeled reported.
This chapter is the cross-layer capstone, not a replacement for the underlying layers. Use §2.3 for the power and cooling market, §2.5 for accelerator competition, §2.6 for networking, §2.7 for memory and packaging, §2.8 for foundry geography, §2.9 for production tools and EDA, §2.10 for materials, §2.11 for financing and §2.12 for policy. Use Part V for company access, fundamentals, and risk profiles.
Chapter endnotes
Footnotes
-
NVIDIA GB300 NVL72. NVIDIA, undated; accessed 2026-07-25. ↩
-
NVIDIA Vera Rubin NVL72. NVIDIA, undated; accessed 2026-07-25. ↩
-
Atlas 900 A3 SuperPoD product specifications. Huawei Enterprise, undated; accessed 2026-07-25. ↩
-
Huawei's SuperPoD Portfolio Creates New Option for Global Computing at MWC Barcelona 2026. Huawei, 2026-02-28; accessed 2026-07-25. ↩